Here are the trend graphs for each city for the latest survey.
View the raw results here, and refresh the site to see other reports as they are added during the day.
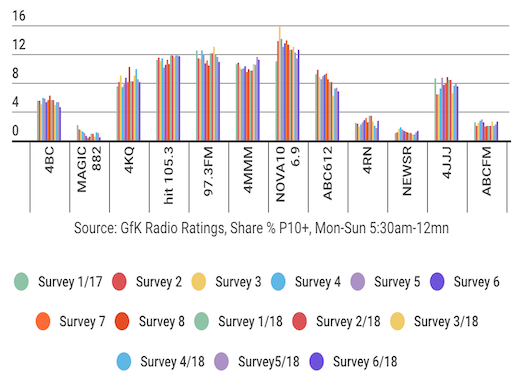
If you mouse over the bars you can see the result for each station by survey, and you can play around with the interactive graphics in other ways as well, such as mousing over the coloured dots at the bottom of the chart to see a specific survey.
Sydney
Melbourne
Brisbane
Adelaide
Perth