Analysis from Steve Ahern.
Fieldwork for ratings survey 3 begins tomorrow, and on Thursday the Survey 2 results will be released.
The seasonal nature of surveys means that Survey 2 will be a good indicator of audience habits for the working year and will knock on to the next few surveys.
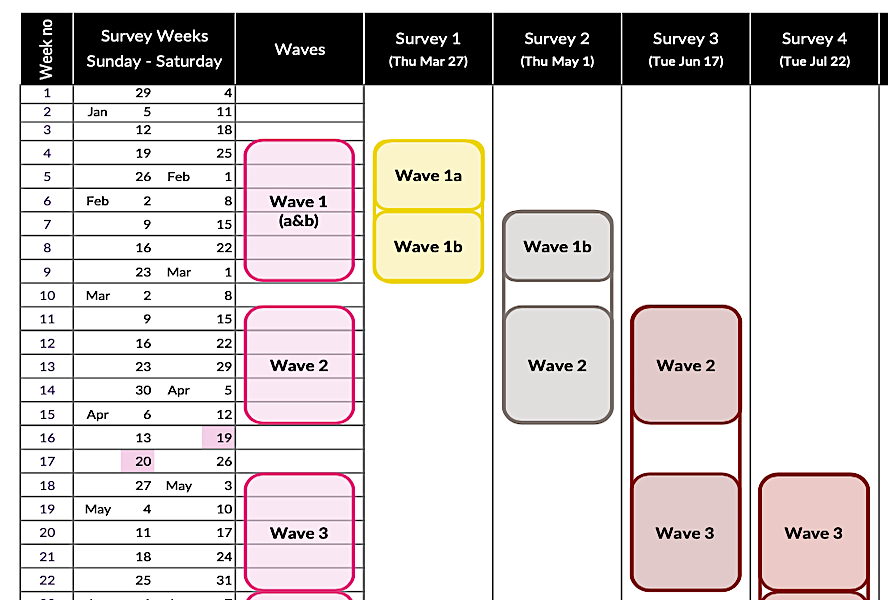
Survey 1 every year is always different due to school holidays, summer weather and sport. Survey 2 usually washes out part of the first ‘A’ Wave of January figures, with the second half (Wave B) of survey 1 being rolled into the results of survey 2. So when you read the results of Survey 2 on Thursday, you will be reading results gathered between February 9 to April 12. Workers usually return to the office (or their work from home office routine) after Australia Day and their commuting and workday habits remain consistent until Easter and/or the first school term holiday break.
The rolling survey methodology works well to smooth out the seasonality of the listening year, as long as you understand it. Further improvements in electronic measurement and capturing streamed listening in recent years have improved the system further.
So what will be the factors influencing Survey 2, as we read the results on Thursday?
Traditionally survey one is a ‘beach and holiday house’ survey. Families on school holidays have different habits. Recent studies by GfK and CRA have debunked the old myth that people listen less during summer holidays. They don’t listen less, but they do listen differently.
There are two holiday factors that matter to the results – weather and sport.
When the weather is good and families head to the beach or the bush, music accompanies them. The weather was not so good this summer, so this was less of a factor in survey 1. There’s another changing dynamic in summer music habits now – music streaming. I have noticed that the music stations were not as strong as I would have expected in recent first surveys, so my assumption is that jukebox radio formats are now encountering increased competition from music streaming services.
The other factor is sport. When the Aussies are winning the cricket against a strong competitor, then radio stations with cricket reports or commentary on them get a boost. However, tv coverage can also draw the sport loving audience away from the radio, so it is not always a consistent trend. Another factor is time zones, I noticed that Perth stations carrying cricket did better in breakfast and mornings this year due to the cricket start time being during breakfast hours in Perth. The same goes for Tennis in the last weeks of January, although the playing times for Aussie competitors at the Australian Open tennis championships are at wildly different times from cricket.
So what will happen in survey 2?
The sport effect and the ‘beach holiday music’ effect will slip away and we will be seeing the results of standard work and school listening habits. This will remain consistent until the second half of the year, when footy finals listening will change the evening and weekend listening habits of footy followers. This usually benefits talk/sport stations.
There are two other wild cards this year that could increase listening to News/Talk stations.
TRUMP.
American President Trump was inaugurated on January 20th this year and has not stopped making headlines since.
His tactic of throwing out a new headline every day, that some say is a trick to distract the news media and the population from the decisions and policies that really matter, was learnt from his time making the reality tv show The Apprentice. It works. News bulletins and talk radio topics have been peppered with Trump issues ever since January. This may have strengthened news/talk/sport stations during survey 1 and survey 2 this year, but will it become a liability if Trump topics contribute to news fatigue after his first 100 days. Podcast stats could be an early indicator of news fatigue about Trump, check the skip and leave moments in your podcast stats to see if they coincide with a Trump mention.
ELECTION.
Then the election was, eventually, called after a long unofficial pre-election campaign. We go to the polls next week.
The big questions in my mind are, will the Trump effect have worn off by now? And what will be the effect of the Australian election?
Sadly, when wars continue for a long time, election campaigns drag on for months, and news vampires suck the life out of a story through too much coverage, the audience is saturated and loses interest. Will this be a factor this survey?
I suspect the Trump effect may already have turned negative as far as audience interest goes, but the election, in my opinion, has still been a reason to listen to news/talk stations and information podcasts for news-engaged audience segments.
MEASUREMENT METHODS.
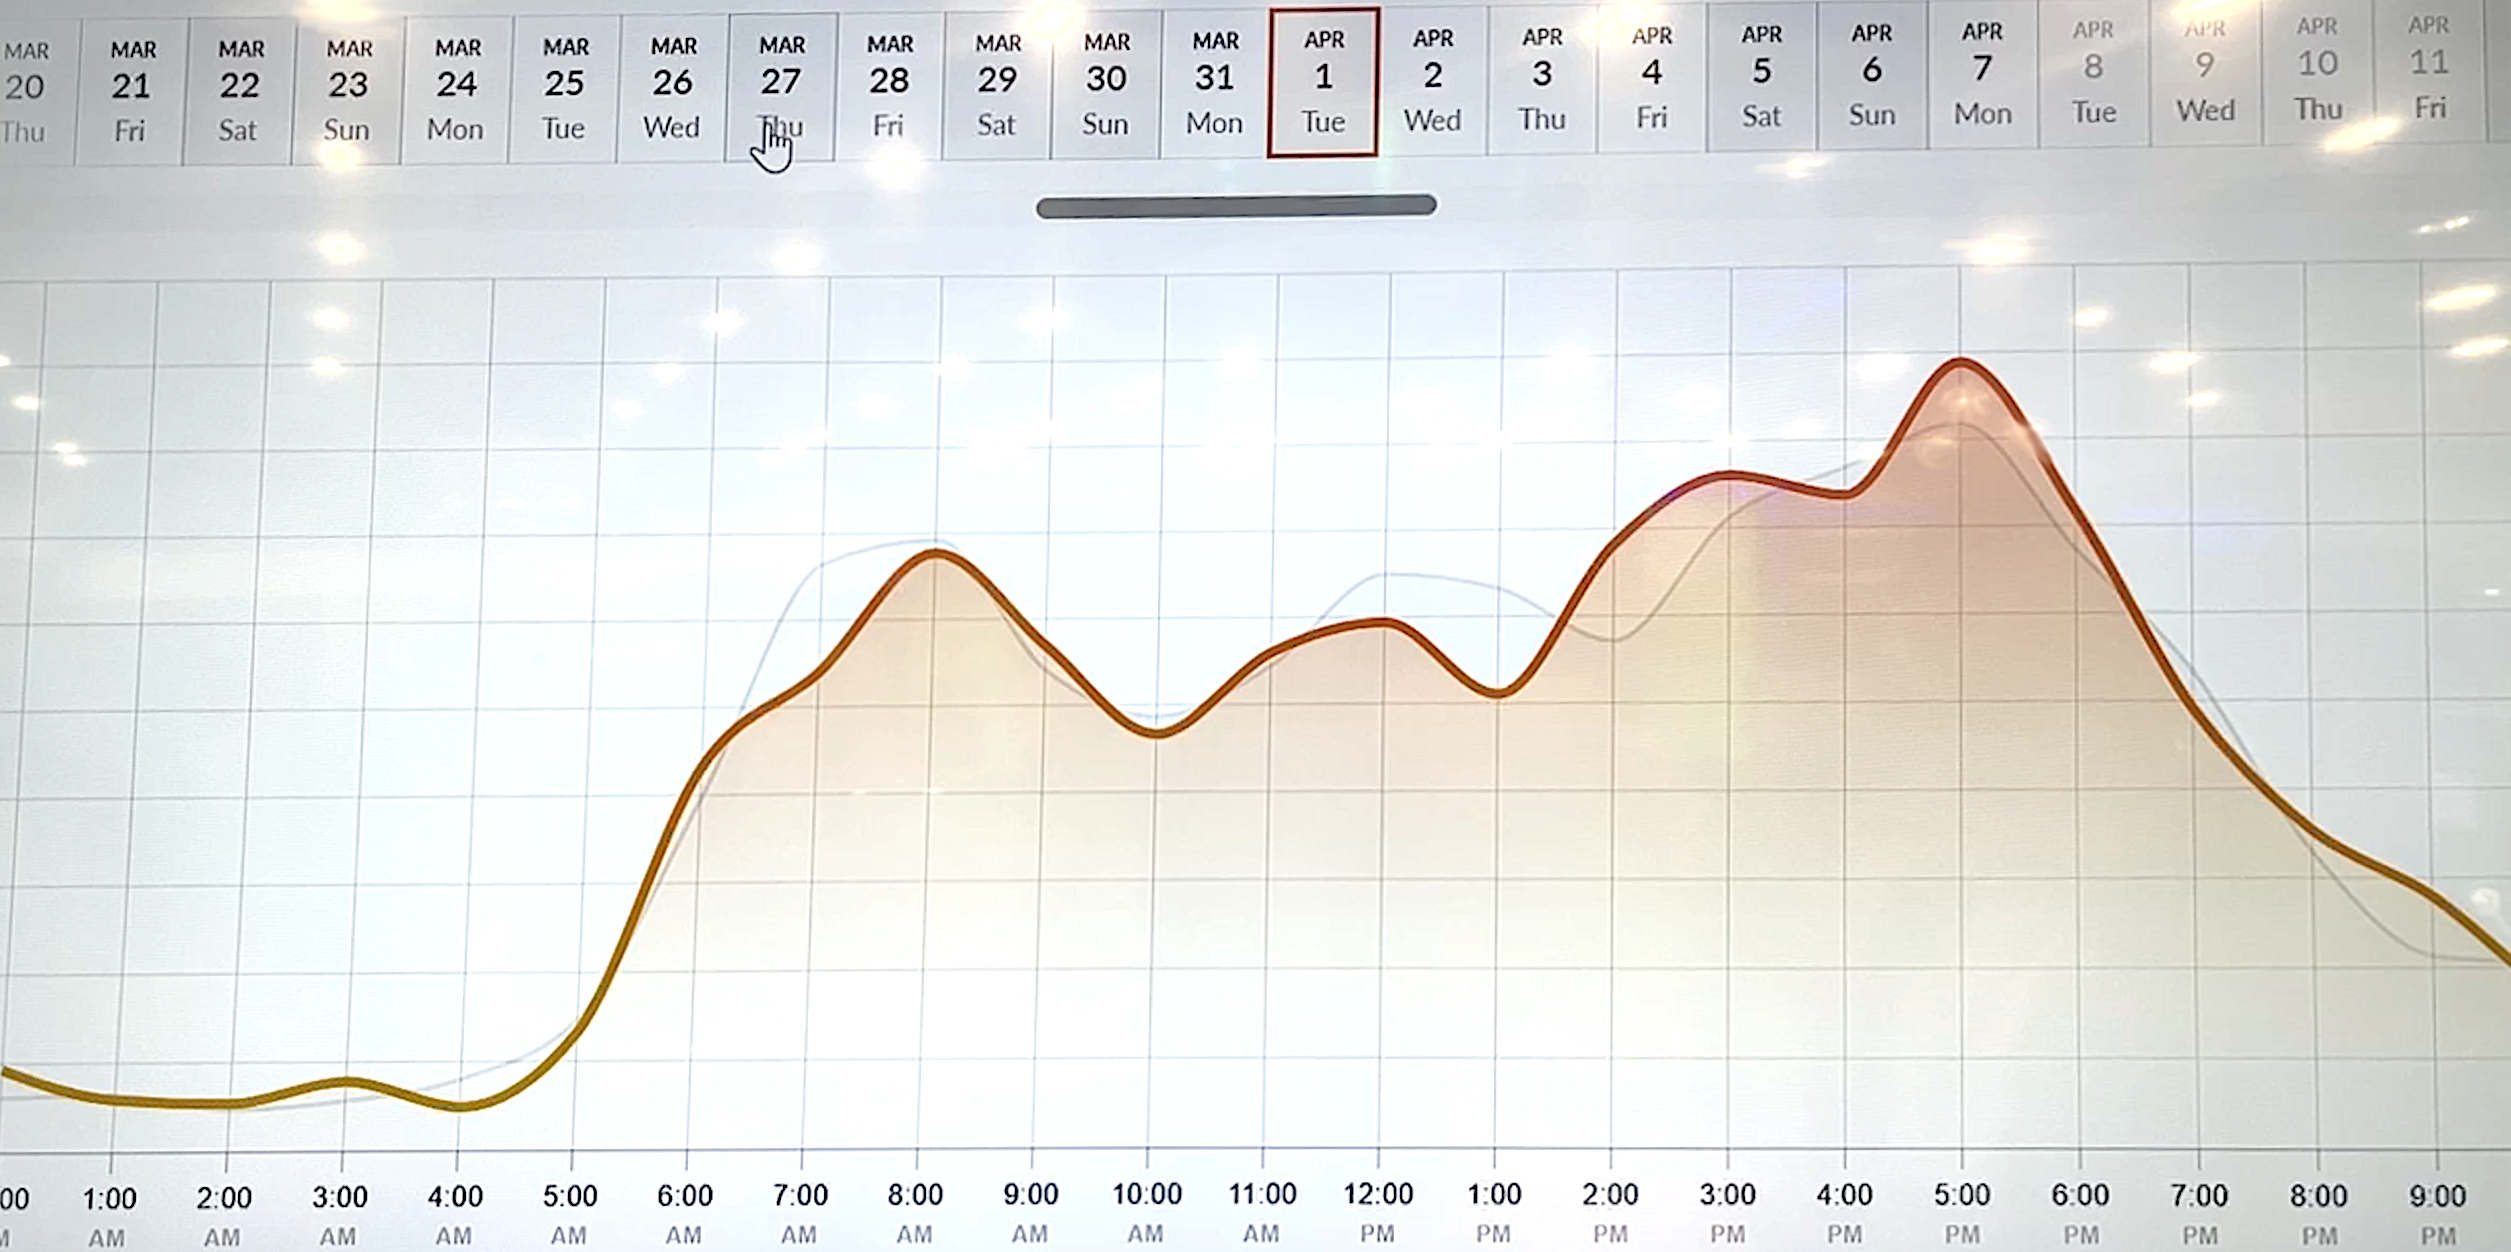
One of the things that impressed me at the recent NAB Show was some real-time interactive data analysis from connected cars. You can see a full report here.
Two things struck me.
The first thing was a comment from Xperi’s Jeff Jury, who quoted real-time car listening analytics saying, “for years I told car companies that radio is the most prominent feature in a car… some believed me, some didn’t… then the car companies started connecting their vehicles and, I was right, around 70% of listening in the car is radio. It’s great validation for radio.”
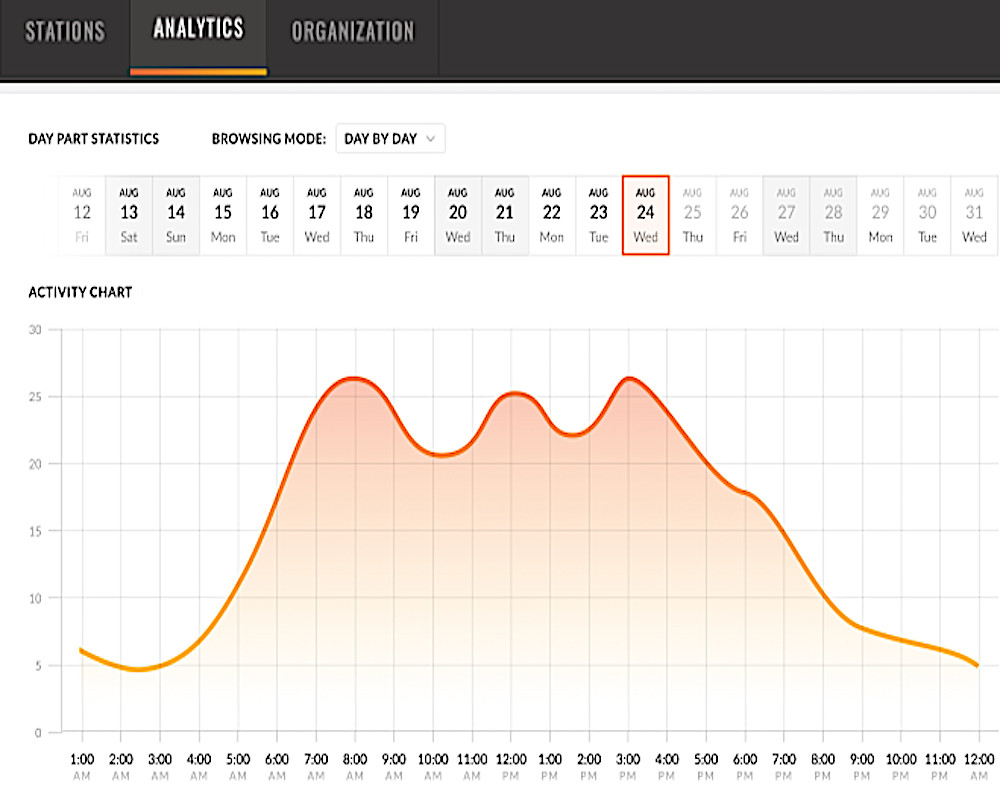
The second thing was an active-data analytics chart showing real car listening trends from connected cars that validates everything we know about current survey based listening habits by using digital data. Information like this gives radio the ability to communicate listening trends using digital methodology in a way that is comparable to TV People Metres or Google Analytics.
The screenshot below from my video report shows a typical workday listening graph of when car radios are turned on. It confirms what we know from all the other data we have had for years, that car listenership spikes at morning commute time, at school pick up time and during the drive home. It’s nothing new, but it is a real-time electronic data measurement method that is useful to help radio compete against digital platforms for advertising dollars and to validate listening trends from other measurement methodologies.
There is more to ratings than just ‘the audience loves XYZ presenter,’ or ‘they hate the new format/lineup.’
Superficial numbers get the newspaper headlines on survey day, but those who really know how it all works spend the next few weeks dissecting the detailed patterns behind the big numbers to work out what’s really going on. They will look at factors such as commuting trends, news coverage, audience connection to personality presenters and competition from music streaming platforms as they make their assessment.
Good luck for Thursday!
Survey results will be released on radioinfo and Radio Today at 0930, Thursday 1 May.
About the Author
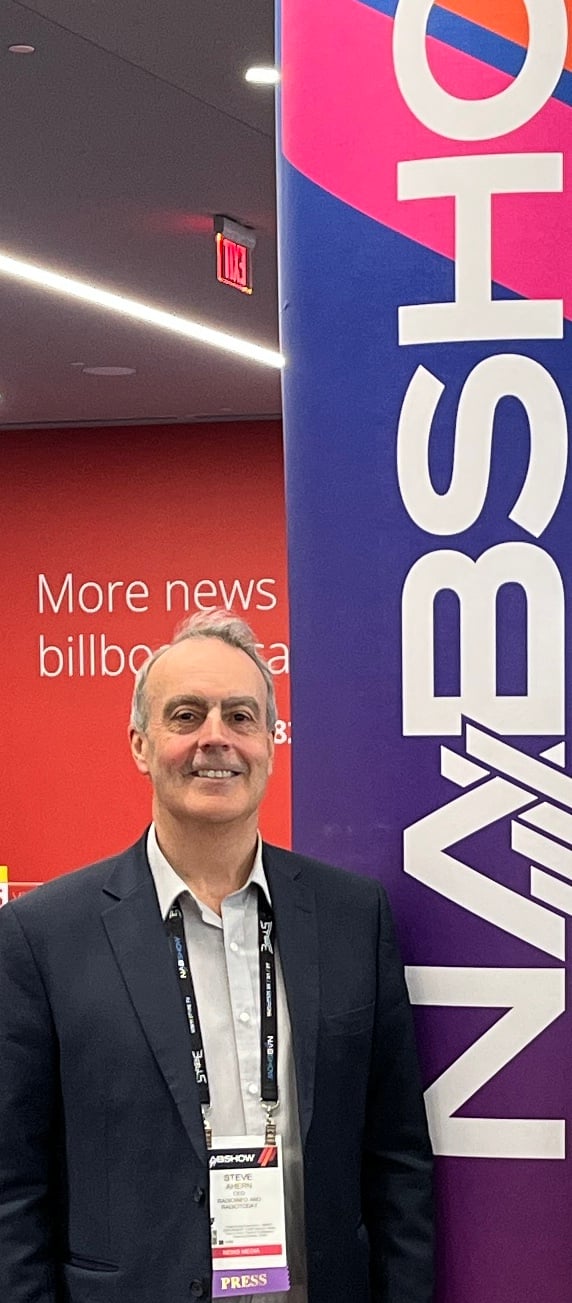 Steve Ahern is CEO of the
training and consultancy company AMT Pty Ltd
and Publisher of this trade journal.